Optimizing Performance
Time is of the escence. Especially if time costs you money. In this section we will cover a few low-hanging fruits you can pluck to improve your simulation performance.
The first point you should consider is the statistics output from a Cloe simulation:
{
  "elapsed": "16.020969ms",
  "outcome": "success",
  "simulation": {
    "achievable_realtime_factor": 3069.367710251688,
    "eta": {
      "ms": 60000,
      "str": "60s"
    },
    "realtime_factor": -1.0,
    "step": 3000,
    "step_width": "20ms",
    "time": {
      "ms": 60000,
      "str": "60s"
    }
  },
  "statistics": {
    "controller_retries": {
      "count": 5998,
      "max": 0.0,
      "mean": 0.0,
      "min": 0.0,
      "sample_std_deviation": 0.0,
      "sample_variance": 0.0,
    },
    "controller_time_ms": {
      "count": 2999,
      "max": 0.007417,
      "mean": 0.0026041783927975965,
      "min": 0.001955,
      "sample_std_deviation": 0.0002609794168588151,
      "sample_variance": 6.811025602396718e-08,
    },
    "cycle_time_ms": {
      "count": 2999,
      "max": 0.027452,
      "mean": 0.004472272424141386,
      "min": 0.003784,
      "sample_std_deviation": 0.0006377127340456161,
      "sample_variance": 4.0667753116393473e-07,
    },
    "engine_time_ms": {
      "count": 3000,
      "max": 0.02149,
      "mean": 0.0002192613333333334,
      "min": 0.000188,
      "sample_std_deviation": 0.0005017647745719333,
      "sample_variance": 2.5176788900122307e-07,
    },
    "padding_time_ms": {
      "count": 2999,
      "max": 0.0,
      "mean": 0.0,
      "min": 0.0,
      "sample_std_deviation": 0.0,
      "sample_variance": 0.0,
    },
    "simulator_time_ms": {
      "count": 2999,
      "max": 0.003764,
      "mean": 0.000688565521840611,
      "min": 0.00066,
      "sample_std_deviation": 6.735377231763926e-05,
      "sample_variance": 4.536530645416388e-09,
    }
  },
  "uuid": "ad4f2854-6804-48c9-a1c9-0810abd35dc7"
}
There are (currently) the following statistics:
controller_retries
controller_time_ms
cycle_time_ms
engine_time_ms
padding_time_ms
simulation_time_ms
These should be interpreted through the following diagram of the Cloe engine state machine:
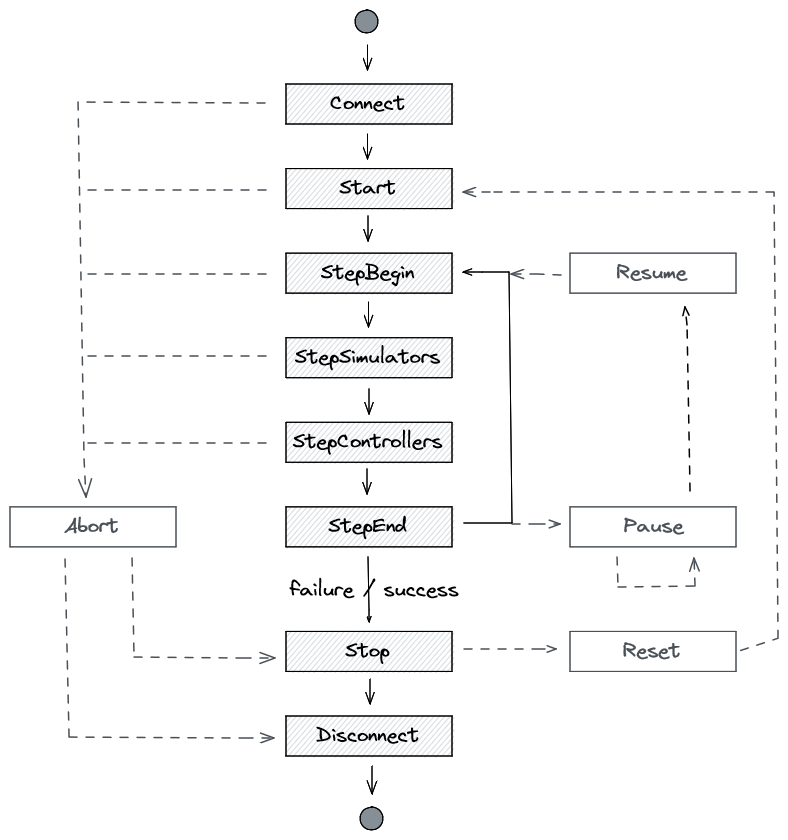
- controller_retries
Tracks how often a controller needs to be called for it to process to completion (the controller
process()method will be called until it signals that it is done). Note that the count is twice as large as the number of steps that the simulation has; this comes from the fact that in this particular simulation there are two controllers.- simulator_time_ms
Tracks how long the engine requires (in milliseconds) in the StepSimulators state, and includes the time for running all simulators for a single cycle.
- controller_time_ms
Tracks how long the engine requires (in milliseconds) in the StepControllers state, and includes the time for running all controllers for a single cycle.
- padding_time_ms
Tracks how much the engine pads (in milliseconds) the simulation to achieve the target realtime. This is performed in the StepEnd simulation state. You can see the final realtime factor in the JSON output. The factor -1 indicates that no padding is used, and the expected value will then be 0 ms padding.
Note
The realtime factor can be modified through triggers (and therefore also through the web UI). These changes are not reflected in the realtime factor output in the simulation results. These just reflect the final state used on termination of the simulation.
- engine_time_ms
Tracks how long the engine requires (in milliseconds) to update various data structures in the StepBegin state. One of the most expensive steps is to update the web server buffer.
- cycle_time_ms
Tracks how long the engine requires (in milliseconds) to perform one full cycle from StepBegin to StepEnd. This should be about the size of all the other metrics combined.
Adjust the Realtime Factor
By default, Cloe will try to run the simulation in “realtime”. That is, every simulated second takes roughly one real second. The engine achieves this by padding in the StepEnd simulation state.
When running simulations headless though, you probably want to simulate as fast as possible, in which case it is recommended to set the realtime factor to -1:
{
  "version": "4",
  "triggers": [
    {"event": "start", "action": "realtime_factor=-1"},
  ]
}
When measuring performance of plugins, such as the simulator, please make sure to use a realtime factor of -1, otherwise the measurement results may be falsified by the simulator processing while Cloe is padding, skewing the processing time for the simulator to the bottom. For example, with the VTD simulator, simulation_time_ms shows ~10ms when the realtime factor is -1, and ~1-2ms when realtime factor is 1. This should not imply that the simulator is more effective or performant when the realtime factor is 1! It simply means that VTD is being triggered to perform calculation asynchronously, which it does while the engine is padding in the StepEnd simulation state.
Disable the Webserver
The web server is currently one of the performance bottlenecks in Cloe, since every single step it fills a buffer of the results from every participant in the simulation that are exposed via the web API. If you do not need the web server, it is recommended that you disable it:
{
  "version": "4",
  "server": {
    "listen": false
  }
}
In the future, the web server backend will be swapped out and the code refactored to minimize the bottleneck.
Profile Plugins
By adding code to plugins, you can profile how long they take in different
segments. To this end, the Cloe runtime includes several utility headers that
are useful: cloe/utility/timer.hpp and cloe/utility/statistics.hpp.
The timer file provides the DurationTimer class that starts measuring at
construction, and runs a function pointer (for example, a lambda) at
destruction. Thus it measures how much real time elapsed during its lifetime.
You can measure the time of a block of code by scoping it. You can also
retrieve the elapsed time by calling the elpased() method.
The statistics file provides the Accumulator class that tracks the running
statistics of inserted doubles. This class does not store the entire data set,
rather it continously updates the min/max/mean/variance of the virtual data
set, using statistical methods.
How does this look in the real world? In the vtd plugin for example,
statistics are tracked for the process() method. A struct is defined
named VtdStatistics which contains several Accumulator variables:
struct VtdStatistics {
  cloe::utility::Accumulator frame_time_ms;
  cloe::utility::Accumulator clock_drift_ns;

  friend void to_json(cloe::Json& j, const VtdStatistics& s) {
    j = cloe::Json{
      {"frame_time_ms", s.frame_time_ms},
      {"clock_drift_ns", s.clock_drift_ns},
    };
  }
};
The process() method contains the following lines then to insert
data:
cloe::Duration process(const cloe::Sync& sync) final {
  timer::DurationTimer<timer::Milliseconds> t(
    [this](timer::Milliseconds d) {
      this->stats_.frame_time_ms.push_back(d.count());
    }
  );

  // [... snip ...]

  // Calculate error of previous timestep for timing statistics
  vtd_timestep_error_ = sync.time() - sensor_time;
  stats_.clock_drift_ns.push_back(static_cast<double>(vtd_timestep_error_.count()));
}